Fruit size monitoring
Background and introduction
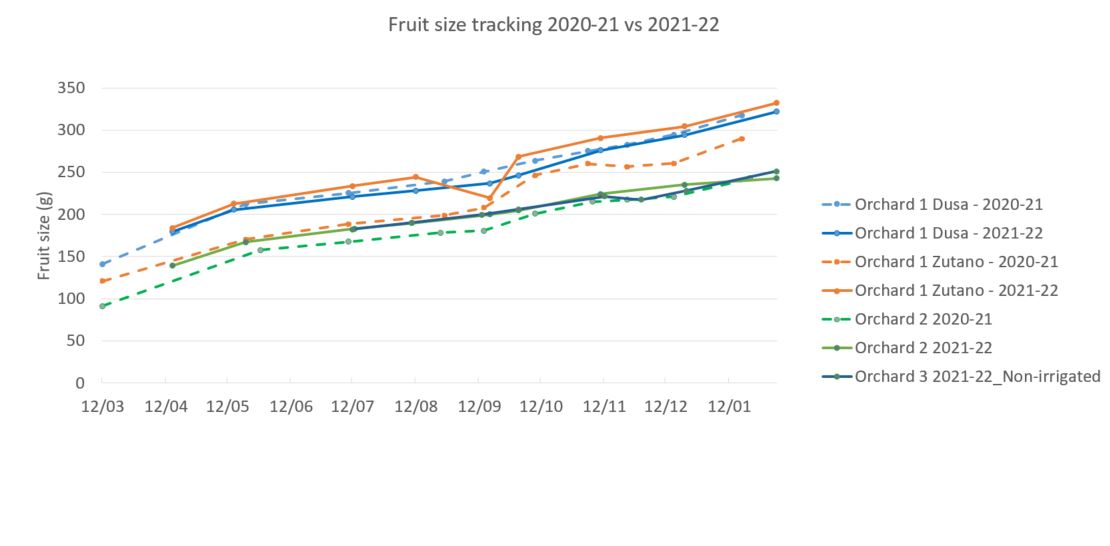
Monitoring fruit size non-distructively over time can help support crop estimation and may offer a tool to predict average fruit size profiles at future harvest dates.
Fruit size profile influences the value of a crop in terms of market preferences for certain fruit sizes and the number of trays produced. The influence fruit size can have on the number of trays packed can also make crop estimation challenging. Larger fruit size profiles can significantly increase the number of trays packed for the same number of fruit.
Avocado fruit growth is characterized by two developmental stages: an initial period of rapid fruit growth (stage I) and a second period of slower growth (stage II) (Liu et al., 1999; Mickelbart et al., 2012; Kaneko, 2016). Stage II growth tends to be quite linear and by understanding the rate of fruit growth, it is possible to forecast how fruit size will change over time. Anecdotally there is little that can influence the rate of fruit growth in stage II. The water content of fruit is high, around 90%, during stage I, but tends to decrease as oil accumulates in the fruit during stage II (Figure 1.3, Chapter 1). At maturity, avocado fruit flesh contains about 70% water (Liu et al., 1999). This experiment is monitoring fruit size non-destructively in stage II to understand variation in sizing rates on different orchards with and without irrigation.
Fruit measurement
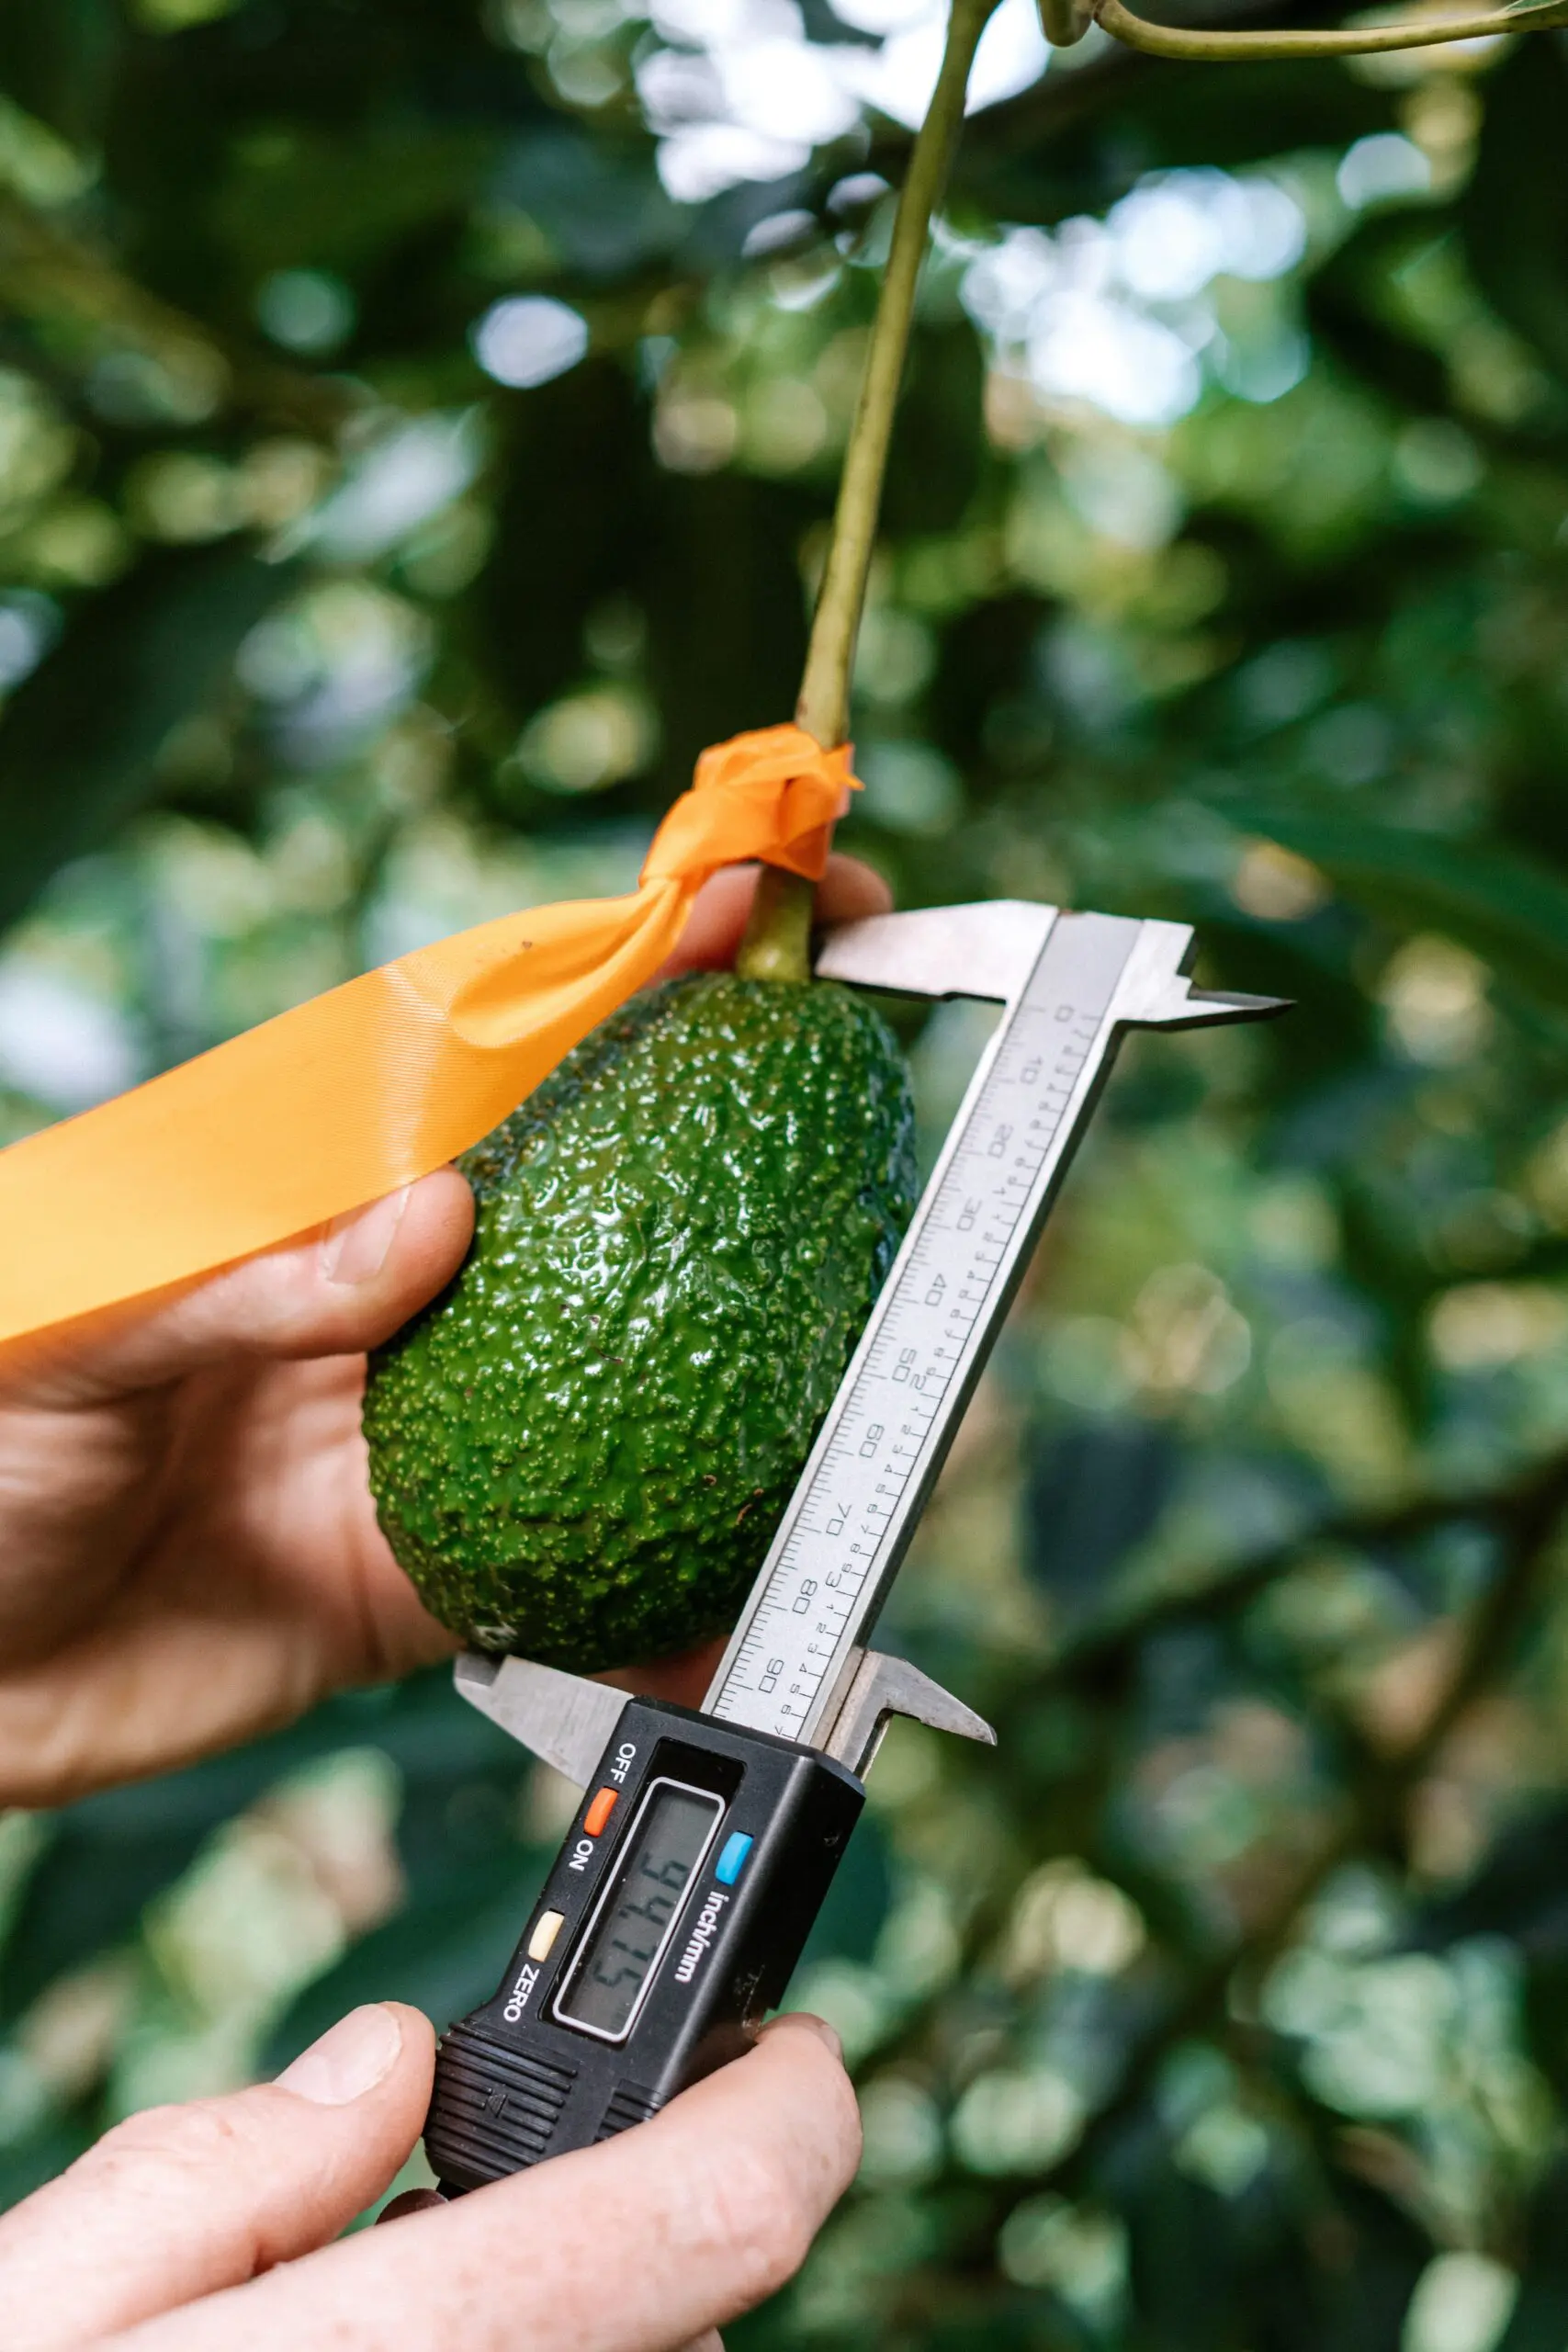
Use callipers to measure one length and two diameters perpendicular to each other on each tagged fruit were measured using digital callipers every two weeks (Figure 1). Record tree and fruit label along with length and two diameter measurements.
Figure 1 Measurement locations for fruit size measurements
Calculation
Previous work has shown that fruit weight can be predicted from the multiple of L x D1 x D2 (LDD), after obtaining the relationship between LDD and actual fruit weight1,2. Destructively harvesting fruit from nearby trees is needed to calibrate the calculation. Harvest 10 fruit with a range of sizes from trees nearby those tagged. Weigh fruit using kitchen scales to the nearest gram and collect one length and two diameter measurements as above. Carry out calibration at establishment of monitoring and then every two months until harvest. A previous study carried out in the Bay of Plenty used the following calculation following calibration.
Fruit weight (g) = (0.48 × LDD (mm3) + 4.2762)/1000
(R2=0.9955)
This may be used as a base calculation until calibration build confidence in correlation between calliper measurements and fruit weight.